You are viewing the chat in desktop mode. Click here to switch to mobile view.
X
5 Ash - Geography
powered byJotCast
Paulina
7:47
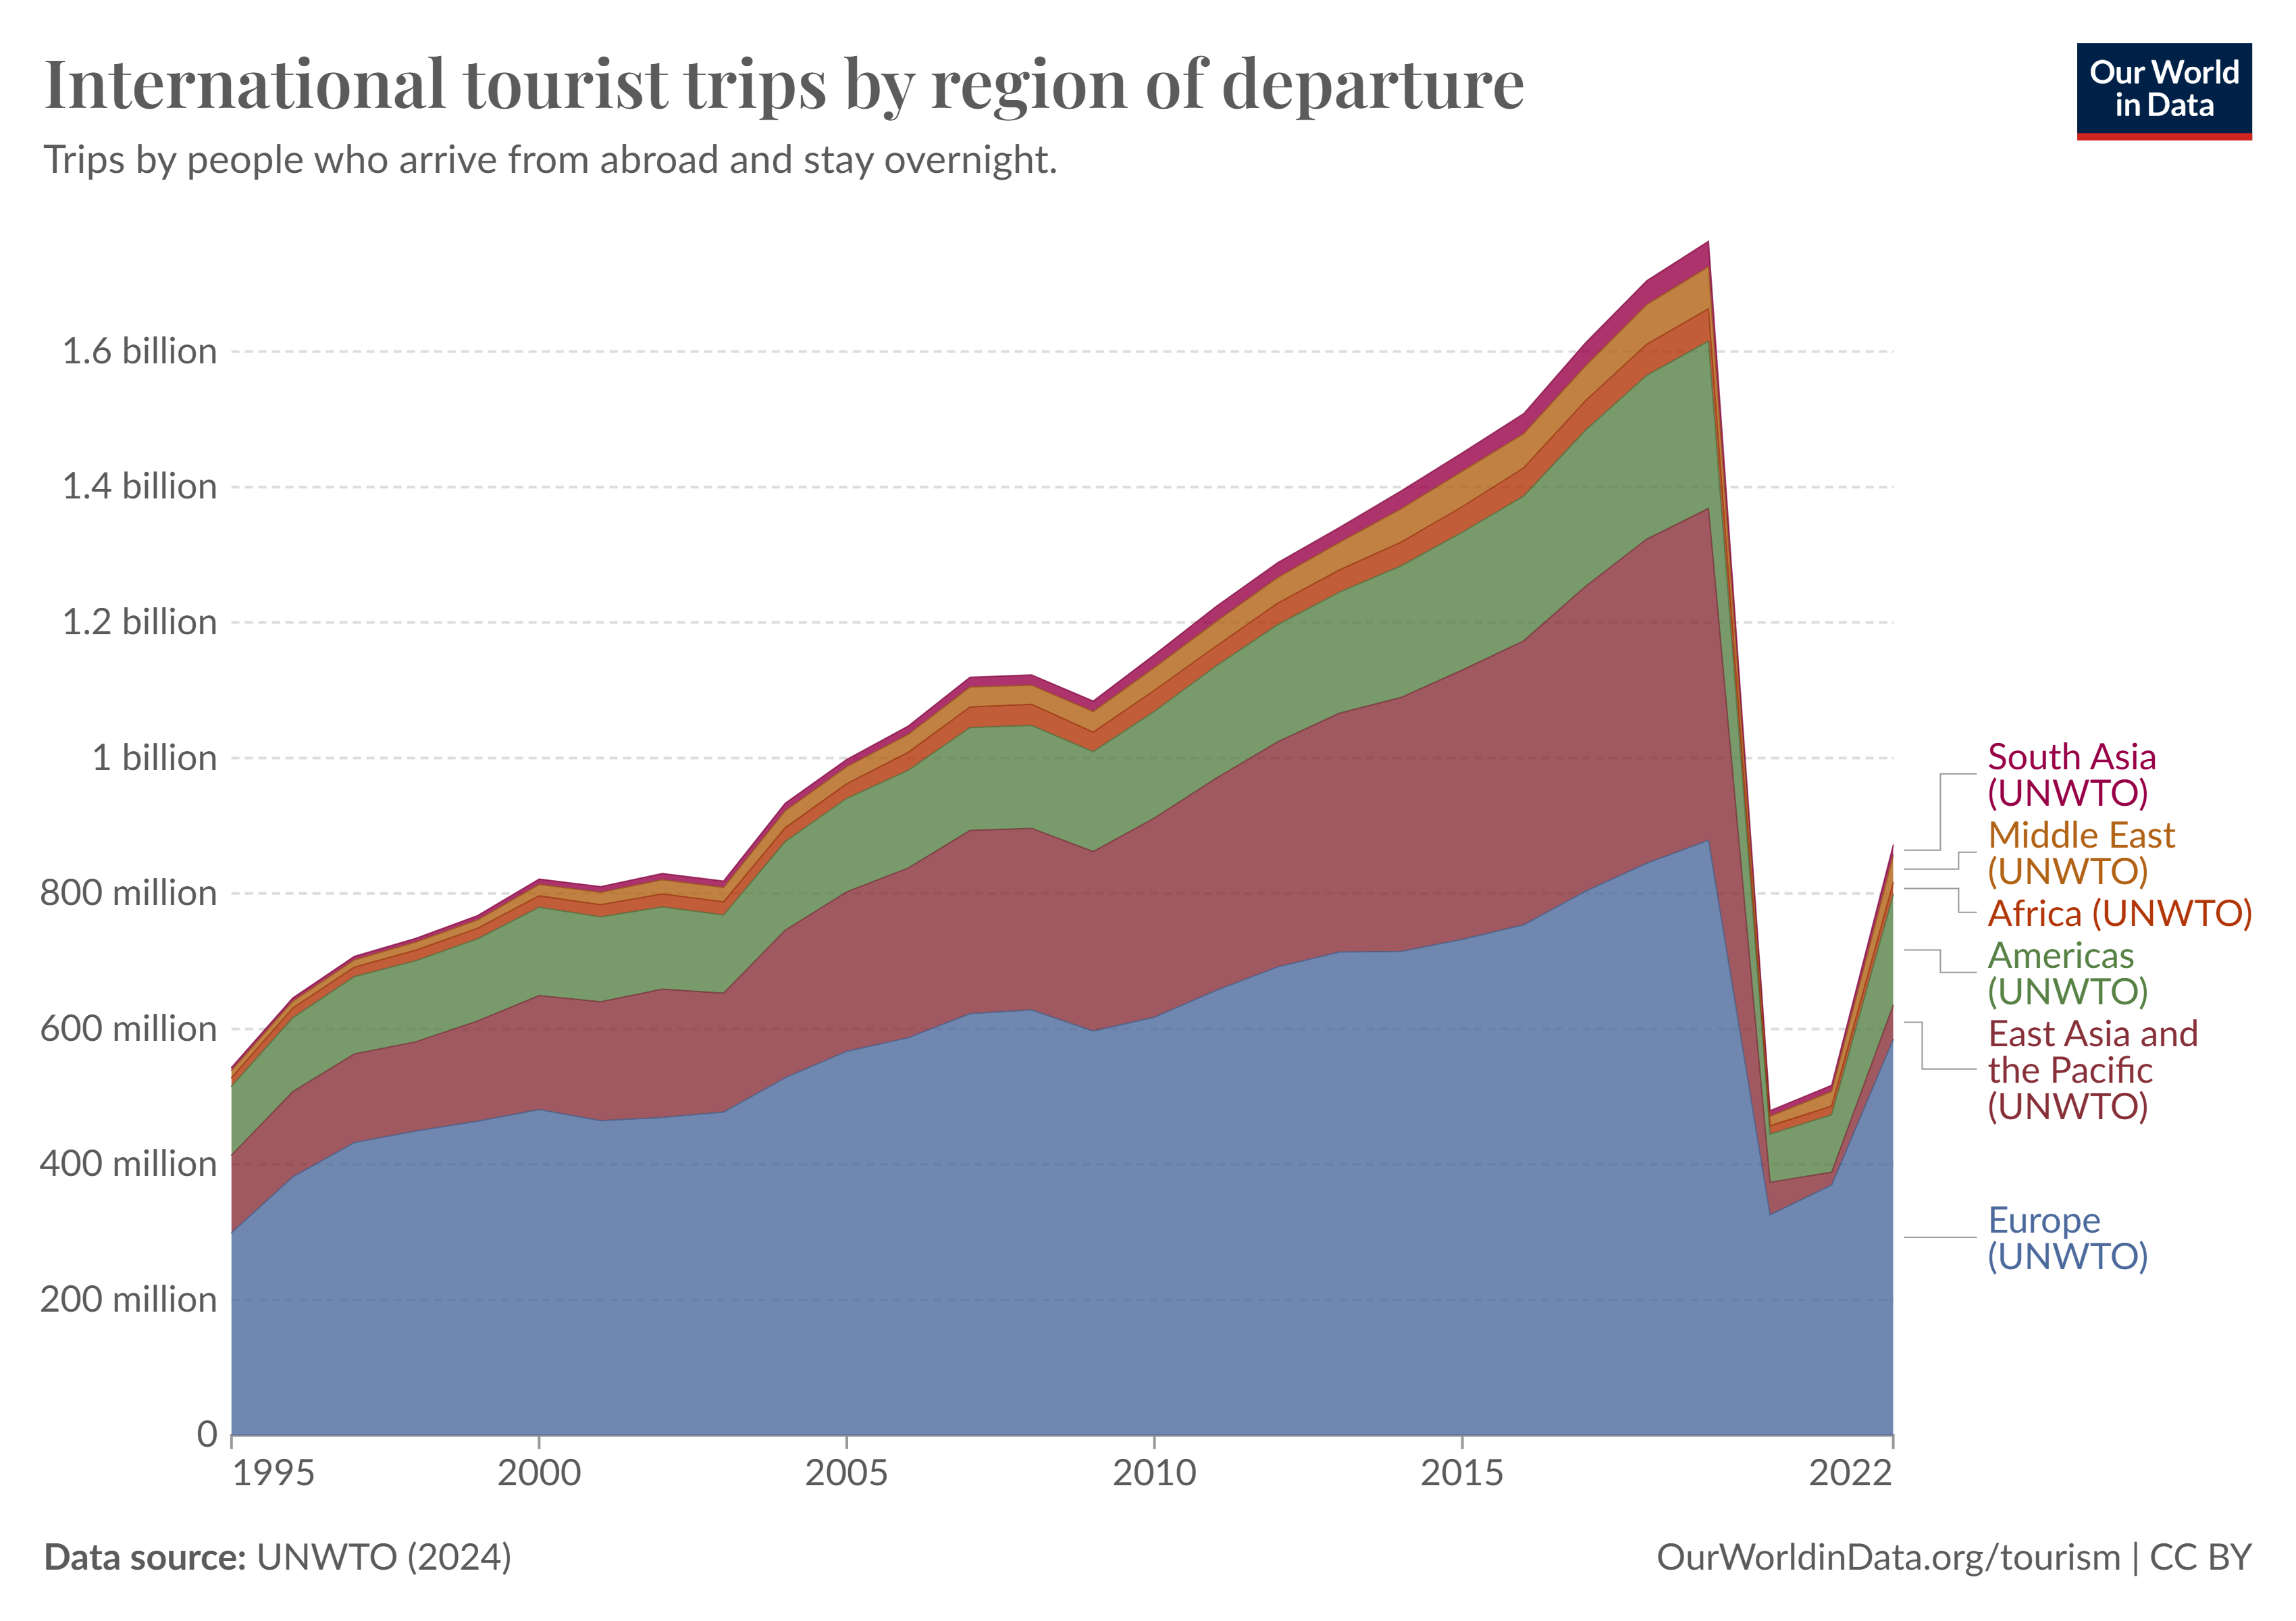
Tourism - What trends do notice in this chart?
Jasper
9:36
It goes down drasticly during covid and then starts to go up again after.
Maximillian
9:37
I notice that lots of tourist trips occured in 2017 or 2018. This shows that there was some very attractive tourist attractions. I also noticed that south asia had the highest point so that lots of the big attractions were there.
joshua and seve
9:37
l notice that  in 2020 there was loads of tourist but in 2022  there was not that much l think that is because of covid
Rachel
9:37
I notice that just before 2022 there was a large amount of people who went on holiday as it was becoming cheap because it was at early stages of inflation and holiday was a massive trend because you go to exotic places like south Asia as that is a popular place.
Alfie
9:37
I notice that the number of tourist trips increase from 1995 to 2019 but then have a sudden decrease between 2019 and 2020.Tourist numbers could have went up because prices got cheaper and it could of had a sudden drop because of Covid-19.
Gioia
9:38
I noticed that around 2018 travelling was most popular as that could have the time where improvements and changes were set
Kayla and Mahrus
9:38
In the graph, it slowly increased. However, near the end of the graph it drastically dropped in 2020. Now, it is slowly increasing again.
Grace
9:38
i noticed that in 1995 there were around 600 mil to 700 mil people and thats a good amount of people because in the olden days only the rich could enter but now in 2022 the population has dropped because of covid.Between 2015-2019 the population was high because all social media apps were trending.
Vanessa
9:38
in the 1995 south asia  was realy high but in 2022 it gone down
Paulina
10:01
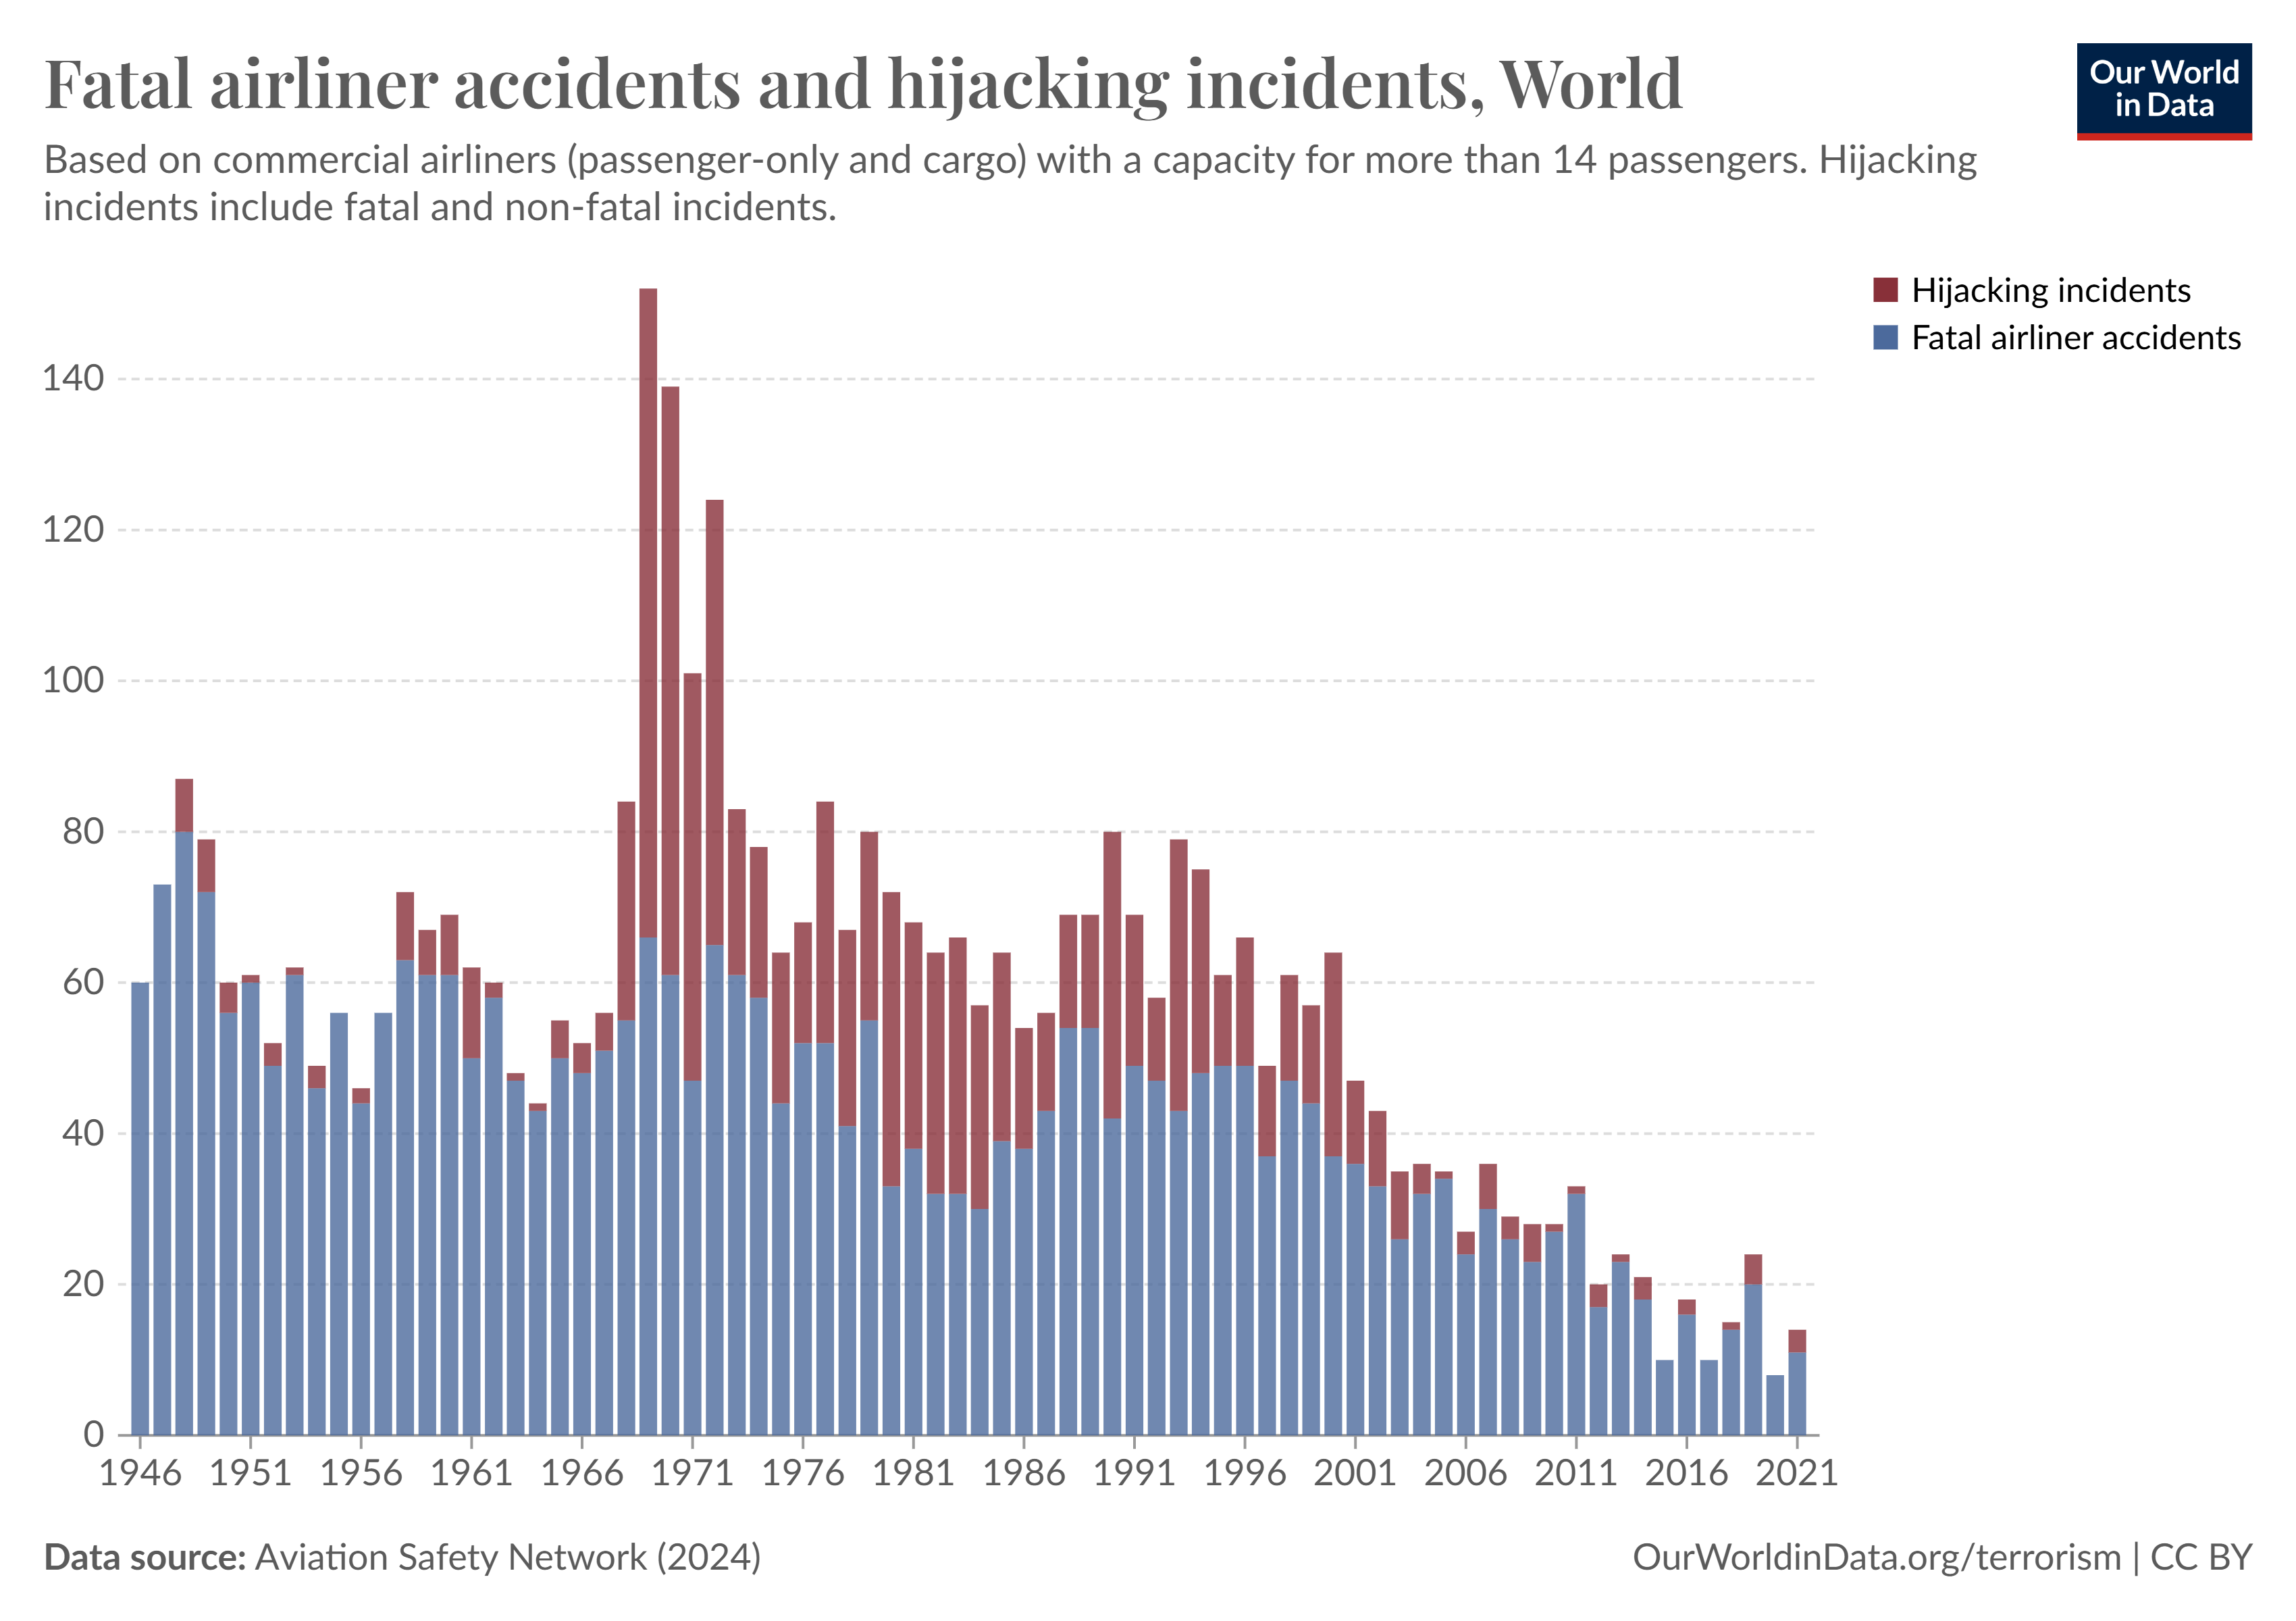
Link this data to the previous graph.
Grace
10:08
Between 1966-1971 there were way more hijacking incidents then accidents.In 1946-1951 there were more accidents than incidents which is way better than 1966-1971.Now,in 2016-2024 there have been less incidents and accidents.
Alfie
10:10
In this diagram I realized that hijacking accidents happened a lot in 1968 - 1970 because cockpits on planes were'nt locked,so anyone could come in.
Jax
10:40
During to COVID there was less accidents and also there was no hijacking incidents. on the other chart there was less flights during to COVID.
Rachel
10:40
Near the end of the graph there was less accidents probably because of security. At the start of the graph there was a small amount probably due to severe punishments and lack of resources.
Maximillian
10:40
I notice that in 1971, the most hijacking incidents occured, having over 145. Also, the most fatal airliner accidents happened in 1948/49 with 80 accidents. However hijacking incidents happen more often.
Gioia
10:40
Between 1970 and 1980, there was a high amount of inccidents  as the cockpit was open there are now less  hijhacking accidents because we have gotten better in achitecture and safety level
Connecting…